LinkedIn analytics software

LinkedIn Outreach Analytics That Turn Campaign Data Into Better Decisions

Neebify helps B2B sales teams, founders, agencies, recruiters, and marketers track LinkedIn outreach performance, acceptance rates, reply rates, meetings, follow-up activity, campaign health, and team performance from one clean analytics dashboard.

7-day free trial · No credit card · Built for human-paced outreach workflows

See which LinkedIn outreach campaigns are ready to scale, which messages need improvement, and which audience segments should be paused before wasting more effort.

Scale winners
Fix weak messages
Pause low-fit segments
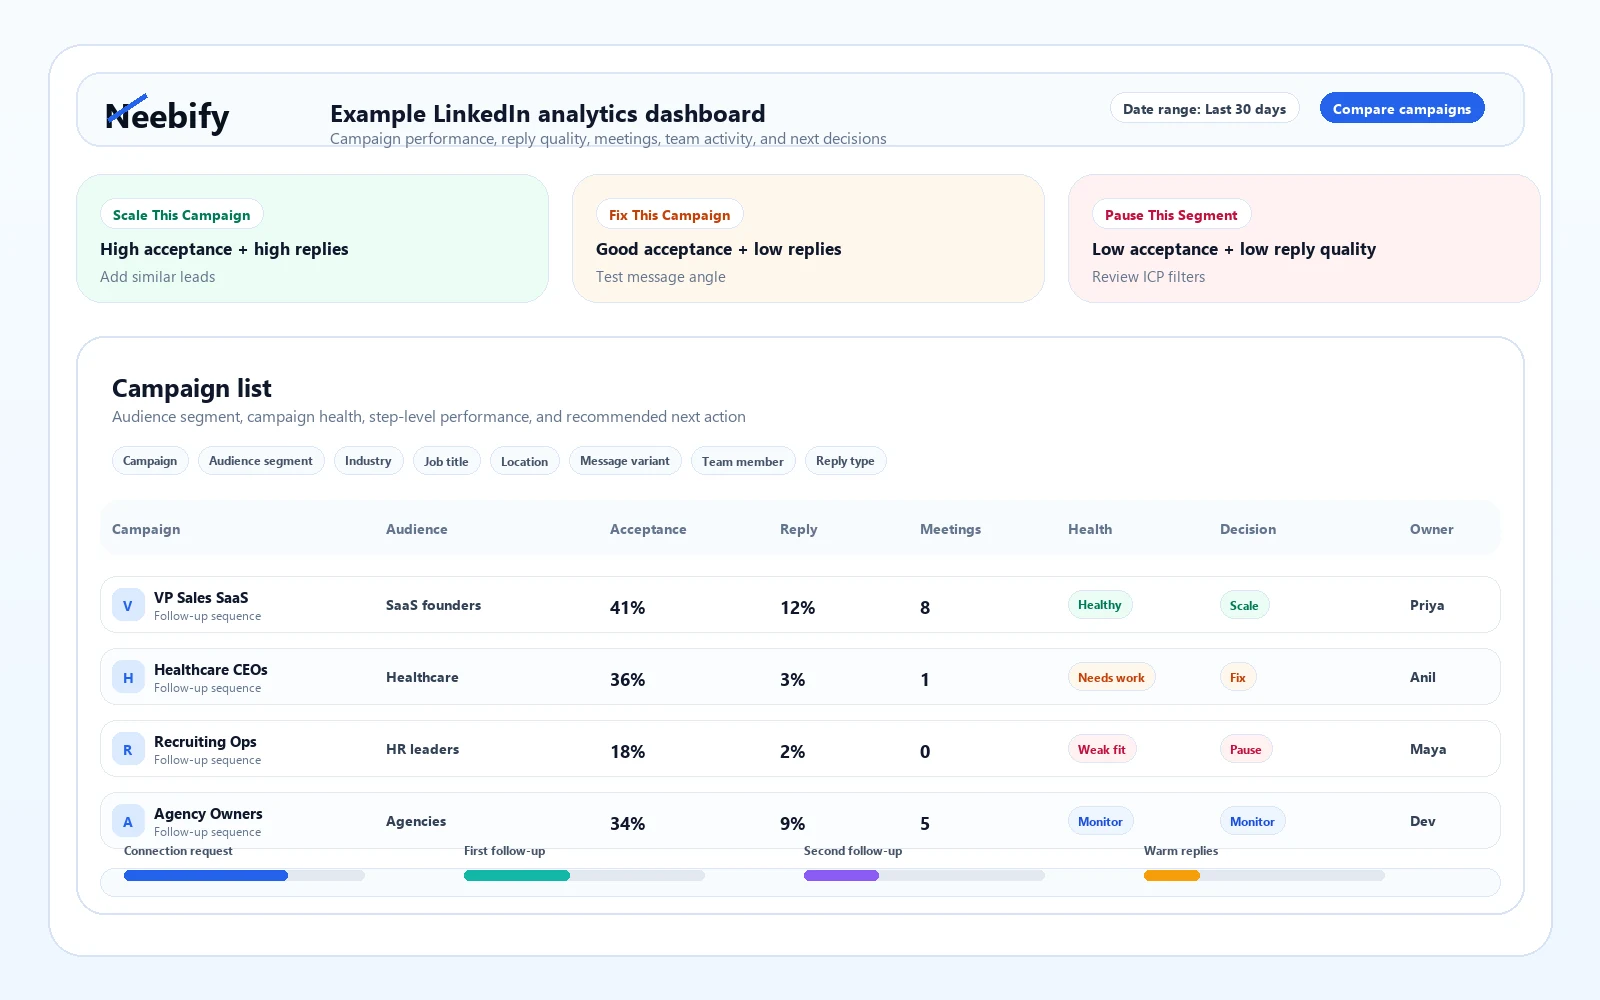
Example LinkedIn analytics dashboard Sample dashboard data
Neebify LinkedIn analytics dashboard showing outreach campaign performance, reply rates, acceptance rates, and meeting tracking

Track campaign health, audience fit, message performance, meetings booked, team activity, and the next decision to make.

Decision layer

Turn Outreach Metrics Into Clear Next Steps

Neebify analytics should help teams understand what to do next, not just what happened. Use campaign data to decide whether to scale, improve, or pause outreach based on acceptance rate, reply quality, meetings, and campaign health.

Scale

Scale This Campaign

High acceptance rate + high reply rate + positive meeting signals

This campaign is showing strong audience fit and message performance. Increase volume carefully, add more similar prospects, and keep monitoring reply quality before scaling further.

  • Add more similar leads
  • Increase volume gradually
  • Reuse winning message angles
  • Create a lookalike campaign segment
  • Monitor meetings booked and reply quality
Needs Improvement

Fix This Campaign

Good acceptance rate + low reply rate

Prospects are accepting the connection request, but the message or follow-up sequence is not creating enough conversations. Improve the message angle, personalization, CTA, or follow-up timing before increasing volume.

  • Rewrite follow-up copy
  • Improve personalization
  • Test a softer CTA
  • Adjust wait times
  • Compare message variants
Pause Segment

Pause This Segment

Low acceptance rate + low reply quality

This audience segment may not be the right fit for the current offer or message. Pause the segment, review targeting criteria, and test a different ICP before continuing outreach.

  • Pause campaign segment
  • Review ICP filters
  • Check job titles and industries
  • Improve lead quality
  • Avoid scaling low-quality outreach
Campaign performance

See What Is Working Before You Scale LinkedIn Outreach

Neebify helps teams track LinkedIn outreach performance from first touch to warm reply. Instead of guessing which campaign, audience, or message is working, your team can review campaign analytics, compare performance, and make better outreach decisions from one dashboard.

01

Acceptance Rate Tracking

Measure how many prospects accept your LinkedIn connection requests and identify which audience segments are responding best.

02

Reply Rate Tracking

Track which campaigns, messages, and follow-ups are creating real conversations.

03

Meeting Signal Tracking

See which replies are turning into demo requests, sales calls, candidate conversations, or booked meetings.

04

Campaign Health Score

Review whether a campaign is performing well, needs improvement, or should be paused.

05

Step-Level Performance

Understand which LinkedIn steps, messages, and follow-ups are helping or hurting campaign results.

06

Team Activity Reporting

Track campaign ownership, assigned reps, outreach activity, replies, and lead status movement.

Analytics workflow

How Neebify LinkedIn Analytics Work

Measure outreach activity, compare campaign segments, understand reply quality, and make the next decision with a clearer view of campaign performance.

See LinkedIn Analytics in a Demo
Step 1

Launch LinkedIn Outreach Campaigns

Build outreach campaigns with targeted prospects, personalized messages, follow-up steps, and human-paced sending settings.

Step 2

Track Campaign Activity

Monitor connection requests, profile visits, sent messages, follow-ups, replies, and lead status updates.

Step 3

Measure Acceptance and Reply Quality

Review acceptance rates, reply rates, warm replies, not-now replies, pricing questions, demo requests, and meeting signals.

Step 4

Compare Campaign Segments

Compare performance by audience, job title, industry, location, campaign type, message angle, or follow-up sequence.

Step 5

Decide What to Do Next

Use decision cards to scale winning campaigns, fix underperforming messages, or pause weak audience segments.

Dashboard controls

Compare Campaigns, Segments, Messages, and Team Activity

Review campaign lists, audience segments, acceptance rates, reply rates, warm replies, demo requests, meetings booked, follow-up performance, campaign health badges, decision recommendations, step-level analytics, team activity, and lead status movement from one workspace.

Campaign
Audience segment
Industry
Job title
Location
Message variant
Date range
Team member
Lead status
Reply type
Decision labels
Scale This Campaign Fix This Campaign Pause This Segment Monitor Closely Needs More Data Strong Reply Quality Low Audience Fit Message Needs Testing
Decision framework

Know When to Scale, Fix, or Pause a Campaign

Outreach analytics are most useful when they help teams make the next decision. Neebify should show clear signals that help users understand campaign quality, audience fit, message performance, and follow-up effectiveness.

Campaign Signal
Meaning
Recommended Action
High acceptance + high replies
Strong audience and message fit
Scale gradually
High acceptance + low replies
Audience is open, message needs work
Improve copy and CTA
Low acceptance + low replies
Weak targeting or low audience fit
Pause segment
High replies + low meetings
Conversations are happening, CTA may need improvement
Improve qualification and offer
High bounces or low-quality leads
Lead source or data quality issue
Review lead data
Follow-ups drive most replies
Follow-up timing is working
Keep sequence active
First message drives most replies
Initial message is strong
Test similar angles
Use cases

Who Uses Neebify LinkedIn Analytics?

B2B Sales Teams

Track campaign performance, reply quality, meetings, and rep activity to improve outbound sales performance.

SaaS Founders

Understand which ICPs, message angles, and LinkedIn outreach campaigns are creating qualified conversations.

Lead Generation Agencies

Report campaign performance, compare client workflows, track replies, and identify which segments should scale or pause.

Recruiters and HR Teams

Track candidate outreach activity, reply quality, follow-up performance, and hiring conversation signals.

Consultants and Service Providers

Measure which decision-makers, industries, and outreach messages are creating real sales opportunities.

Trust and reporting

Built for Clear Outreach Reporting and Better Campaign Decisions

Neebify gives teams visibility into LinkedIn outreach performance without forcing them to manage reports manually across spreadsheets. Track campaign health, team activity, replies, meetings, and follow-up performance from one connected analytics workspace.

Clear Campaign Visibility

See what is happening across active LinkedIn outreach campaigns.

Better Message Testing

Compare message angles, follow-up timing, and campaign segments.

Cleaner Sales Reporting

Turn campaign activity into reports your team can understand.

Smarter Scaling Decisions

Scale only the campaigns that show strong audience fit and reply quality.

Team Performance View

Understand which reps, campaigns, and workflows are moving leads forward.

FAQ

LinkedIn Analytics FAQ

What is LinkedIn outreach analytics?

LinkedIn outreach analytics helps teams track campaign activity, acceptance rates, reply rates, follow-up performance, meetings, and campaign health from LinkedIn outreach workflows.

What metrics can I track in Neebify?

Neebify should help track connection requests, acceptance rates, reply rates, warm replies, demo requests, meetings booked, follow-up performance, campaign health, and team activity.

Can Neebify show which campaign should be scaled?

Yes. Neebify should include decision signals that help users identify campaigns with strong acceptance rates, reply rates, and meeting signals.

Can Neebify help improve low-performing campaigns?

Yes. Neebify analytics should help users find campaigns with good acceptance but low replies so they can improve message copy, personalization, CTA, or follow-up timing.

Can I pause weak audience segments?

Yes. Neebify should help users identify segments with low acceptance and low reply quality so teams can pause weak segments and test better targeting.

Can agencies use Neebify analytics for reporting?

Yes. Agencies can use Neebify analytics to track campaign performance, compare outreach workflows, and report LinkedIn outreach results more clearly.

Next step

Ready to Turn LinkedIn Outreach Data Into Better Campaign Decisions?

See how Neebify helps your team track acceptance rates, reply rates, follow-up performance, meetings, campaign health, and decision signals from one clean analytics dashboard.

7-day free trial · No credit card · Built for human-paced outreach workflows